June 2025 Retrospective
Introduction
Weeks 1 and 2 of June were filled with a lot of second-guessing.
I wanted to encounter more varied, harder problems — but somehow the project and everything around it started feeling small to me, and I couldn't give it my full attention. Even while trying to stay grateful every day, there was this undeniable restlessness.
But during week 2, after some coffee chats with a friend who runs his own business and a few senior developers, everything converged on one question: "Do you have experience actually solving a customer's problem?" Finding a real answer to that felt like the thing that mattered most.
I was reminded, again, that I need to do better work at the company I'm at right now.
"How much did I actually care about the customer..."
"How hard did I try to understand the customer..."
Reflecting on all that, from week 3 onward I tried to sharpen my instinct for using technology to solve real problems.
That context is what led me to propose the monthly report feature — and once I started building it, new doors began to open.
"Then one day, I got through the document screening at four companies." Wait, what??
June Action Points
- Implement monthly report generation and export feature
- Establish a stable workflow for the FuturismLabs design system
- Read Object-Oriented Myths and Realities and write up thoughts
- Read the unit testing book and write up thoughts → start applying unit tests to the simplest frontend logic first!
- Consolidate and share insights from the Next.js study group (no mindless studying)
- Broaden my thinking through networking fundamentals
- Study XSS and document the findings
- Study CSRF and document the findings
- Deep-dive into OAuth and document the findings
Unplanned, but done
- Changed jobs to an environment where I can contribute more
I kept pushing studying down the priority list because it didn't feel immediately necessary — and as a result, a lot of items went unchecked. But this was the most intensely lived month I've had.
After receiving the final offer, what I felt most clearly was that the experience of actually solving a customer's problem is more valuable than almost anything else. From here on, I want to obsess over understanding customers. Even one customer is a customer.
Main Body
Planning and Building the Monthly Report Feature
I'll give a quick bullet-point summary of the situation, since this might need some context.
First, let's look at the prototype I put together quickly.
Why I proposed and built this feature
-
Problem
- A sharp spike in crypto asset prices triggered a flood of customer inquiries, and our team was losing sleep keeping up with support.
-
Action
- Proposed a monthly report feature as a way to proactively address customer frustration (this had been attempted in the past but never sustained).
- However, the feedback was that we had too many customers to realistically publish individual monthly reports one by one.
- So I proposed and built an automation feature directly inside the dashboard.
- However, the feedback was that we had too many customers to realistically publish individual monthly reports one by one.
- Proposed a monthly report feature as a way to proactively address customer frustration (this had been attempted in the past but never sustained).
-
Result
- Time to generate a monthly report dropped from 480 minutes → 2 minutes (99.6% reduction)
- Customer support requests decreased from an average of 30 per month to 12 (60% reduction)
Feature Planning
I started planning.
1. What information should actually go into a monthly report?
I started by digging through past history and got hold of a monthly report PowerPoint from a colleague. From there, I separated what needed to be dynamic from what could be static, and began organizing the data. I can't go into detail, but to keep it simple: we have a significant number of active accounts in the system. The key insight was that a report doesn't map one-to-one to an institution — it maps one-to-one to the individual accounts under each institution.
For each account, from the point it was created, we need to show a performance chart and related return data. But where does that data come from? It's scattered across the dashboard, which means the frontend has to assemble it.
2. How do we build this so it's immediately usable by teammates?
It has to be as simple as possible. Everything should be obvious at a glance.
This was honestly the hardest part. Since the goal at this stage was just to find out whether the feature actually solved the problem, I didn't need it to be polished — I just needed to know if it helped. So I kept it simple.
The basic flow was:
Click report tab → Select account → Export
You need to select an account, and there needs to be an export button. Simple enough.
Q. But what format should the export be in?
I started with PDF. That's when things got more complicated than expected. Committing to PDF meant committing to getting every detail right, because it's hard to iterate on. And then I hit a wall where CSS wasn't being applied correctly during the PDF conversion. That cost me about a day.
So I stepped back and reconsidered. The end goal was PDF, but what if I started by just making the data copyable — via PPTX export? I looked for a library that could handle PPTX conversion easily, found one, tried it, and immediately felt like this was the right direction. And it turned out to be more useful in practice anyway.
Somewhere in the middle of building this, I reminded myself what I was actually making: a monthly report. Which means users need to be able to select a specific month for a specific account, then filter to only that month's data and display it as charts and tables. Oh — it was starting to get a bit more complex.
So the flow was updated:
Click report tab → Select account → Select month → Export
Then I realized: from the user's perspective, they'd probably want to preview the data before exporting, to make sure it looks right. I asked a colleague and got instant confirmation — yes, that would be great.
So another step was added:
Click report tab → Select account → Select month → Preview inside the report page, or export
This wasn't quite what I had in mind originally, and it was looking more complex than I'd expected. My confident claim that I'd show results within a week was starting to feel shaky. But knowing this would genuinely help my teammates made me nervous and excited at the same time.
Feature Development
1. So how did I actually build it?
The chart came together faster than expected.
export const AumChartForReport = () => {

  const { isMobile } = useDevice();

  const { data: accountList } = useSuspenseQuery(AccountQueries.getAdminAndStaffAccountsQuery());
  const uniqueStrategies = getUniqueFieldValues(accountList, 'strategy');
  const { getFilteredAums } = useHistoricalAumWithStore();
  const result = queryTotalEquityByDate(getFilteredAums());
  const sortedList = result.sort((a, b) => a.timestamp - b.timestamp);

  const { filteredData, timeRange, handleTimeRange } = useDurationFilter(
    sortedList,
    (item) => item.timestamp,
  );

  const { data: organizationList } = useSuspenseQuery(OrganizationQueries.getAdminOrgQuery());

  const { filters, handleStrategy, handleOrganization } = useFilterByDomain();

return (
    ...
    )
}
The business logic isn't perfect, but I managed to extract a reasonable amount of it into custom hooks. When I copied just those hooks into a new View component, everything worked right away.
Nice!
Then I used a library called html2canvas to convert the DOM to an image and embed it in the PPTX.
What about the table at the bottom and its corresponding data?
That part went more smoothly than I expected too. I could reuse logic I'd already built for the return rate tracking feature. At the time, I hadn't imagined anyone would use that return-rate-by-day/month/year calculation logic elsewhere, but thinking carefully about it back then is paying off now. Keeping functions under three arguments, making each function do only one thing, and separating commands from queries — a principle from Robert C. Martin's Clean Coder — turned out to be the key.
- A command changes internal state and returns nothing.
- A query returns a value without changing internal state.
To share a simplified version of some domain-specific logic:
const PerformanceSection = ({
  filteredDailiesBySelectedMonth,
  filteredDailiesFromInception,
}: {
  filteredDailiesBySelectedMonth: Dashboard['dailies'];
  filteredDailiesFromInception: Dashboard['dailies'];
}) => {
    const earliestDailyFromInception = getEarliestTimestamp(filteredDailiesFromInception);
    const earliestDailyFromMonth = getEarliestTimestamp(filteredDailiesBySelectedMonth);
    const latestDaily = getLatestTimestamp(filteredDailiesFromInception);

    const returnValue = calcReturnMonthAndYearToDate({
        dailies: filteredDailiesBySelectedMonth,
        selectedDate: dayjs.unix(latestDaily.updatedTimestamp).toDate(),
        key: "month",
    });

    const mdd = calculateMaxDrawdown(filteredDailiesBySelectedMonth);
    const inceptionMdd = calculateMaxDrawdown(filteredDailiesFromInception);

    return (
        ...
    )
}
All of these functions are pure calculation functions. They're covered by unit tests, so I can confidently tell teammates: the numbers work exactly as the logic says they should.
This kind of reuse made the implementation far less daunting than I expected.
I used pptxgenjs to make the tables in the UI appear identically when exported to PowerPoint.
4. How could this be improved? (A note for whoever works on this next)
Right now it's only the ideas in my head that made it into the build.
First: the current flow is to export as PPTX, then manually copy-paste into a PDF to send to customers — but it should be possible to output directly as PDF. Though rendering fidelity can be tricky on the client side. One solid approach would be to handle this server-side using something like Puppeteer, which can use Chromium on the server to generate more accurate image or DOM-to-PDF conversions.
It would also be really nice to show the monthly report directly on a page customers can access.
Right now this is a web app, so push notifications aren't possible. PWA would technically enable it, but I found that customers don't want that. Another option might be a lightweight native app that delivers reports via push notifications — though I'm still not sure if that's actually what customers want.
My First Job Change — Done
On June 13, 2024, I joined FuturismLabs, a company I'm genuinely grateful to have found. At the time, I had DND IT club experience and a few personal projects, but no real professional experience — and they believed in me anyway and gave me a shot. Whenever things get hard, thinking back to that moment keeps me from losing perspective.
A year later, unexpectedly, a door opened to a company where I could contribute more and grow personally in ways I hadn't anticipated. I received and accepted a final offer.
The biggest reason for the move, honestly, is the environment for contribution. The new company runs its own platform product, and just through the interview process alone, I could see five concrete areas where I could make an impact. There was no way not to be excited. I'm deeply grateful.
I was sincere in that gratitude, and I plan to express it properly and wrap things up gracefully in early July. July feels like it's going to be the most calm and joyful month of my life. I'm looking forward to it.
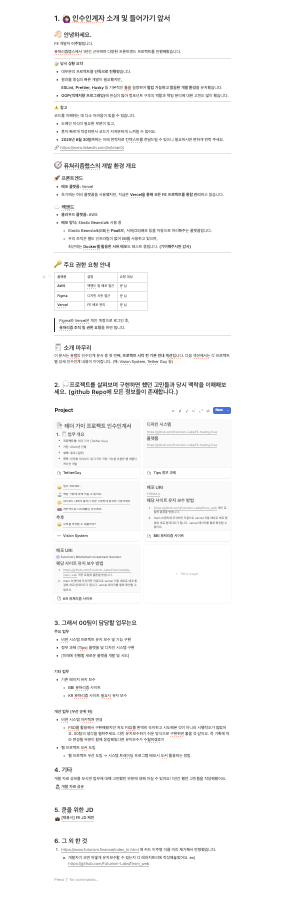
I'm working on the handover document — let me make it a good one.
Conclusion
This month I didn't get to spend as much time on development as I would have liked, but the thing I came away with most clearly is that contribution-centered thinking is what matters.
At home, at work, and in how I treat myself — I want to live a life of genuine contribution. More proactively, more deliberately.
In July, I want to look back over everything from the past year, review what I fell short on, and use that to prepare for the next step. It feels like a rare and precious stretch of time. I'm planning to visit my parents and relatives and mentors I haven't seen in a while.
Keep going, everyone, wherever you are
July Action Points
Development
- Implement the UI for my personal side project — real-time cafe availability lookup
- Study DDD (it came up in an interview) and write it up on the blog
Life
- Wrap up handover at FuturismLabs thoughtfully and well
- Compile everything from the past year into a career summary
- Rest with a healthy routine and lose 1kg
- Take my parents out and have a good time on their birthday
Have a question about this post, or curious about me? Reach out anytime.